SQL GROUP BY & Aggregations: The Analyst’s Guide to Smarter Insights
In the world of business analysis, SQL often feels like a second language. For many analysts, it begins with writing simple queries pulling data with SELECT, filtering with WHERE, and joining tables with JOIN. Yet, at some point, every analyst encounters the same roadblock: How do I summarize this data into meaningful insights without losing detail?
That’s where GROUP BY and aggregation functions come in.
Whether you’re calculating total sales per region, average revenue per customer, or the maximum response time for a support team, GROUP BY enables analysts to transform raw datasets into summaries that answer real business questions. Without it, analysts would drown in endless rows of transactions and interactions.
In this article, we’ll take a deep dive into SQL GROUP BY and aggregations not just the syntax, but also the business value, problem-solving strategies, common mistakes, and real-world use cases. By the end, you’ll understand how these functions act as the foundation for building dashboards, reports, and actionable insights.
What is GROUP BY in SQL
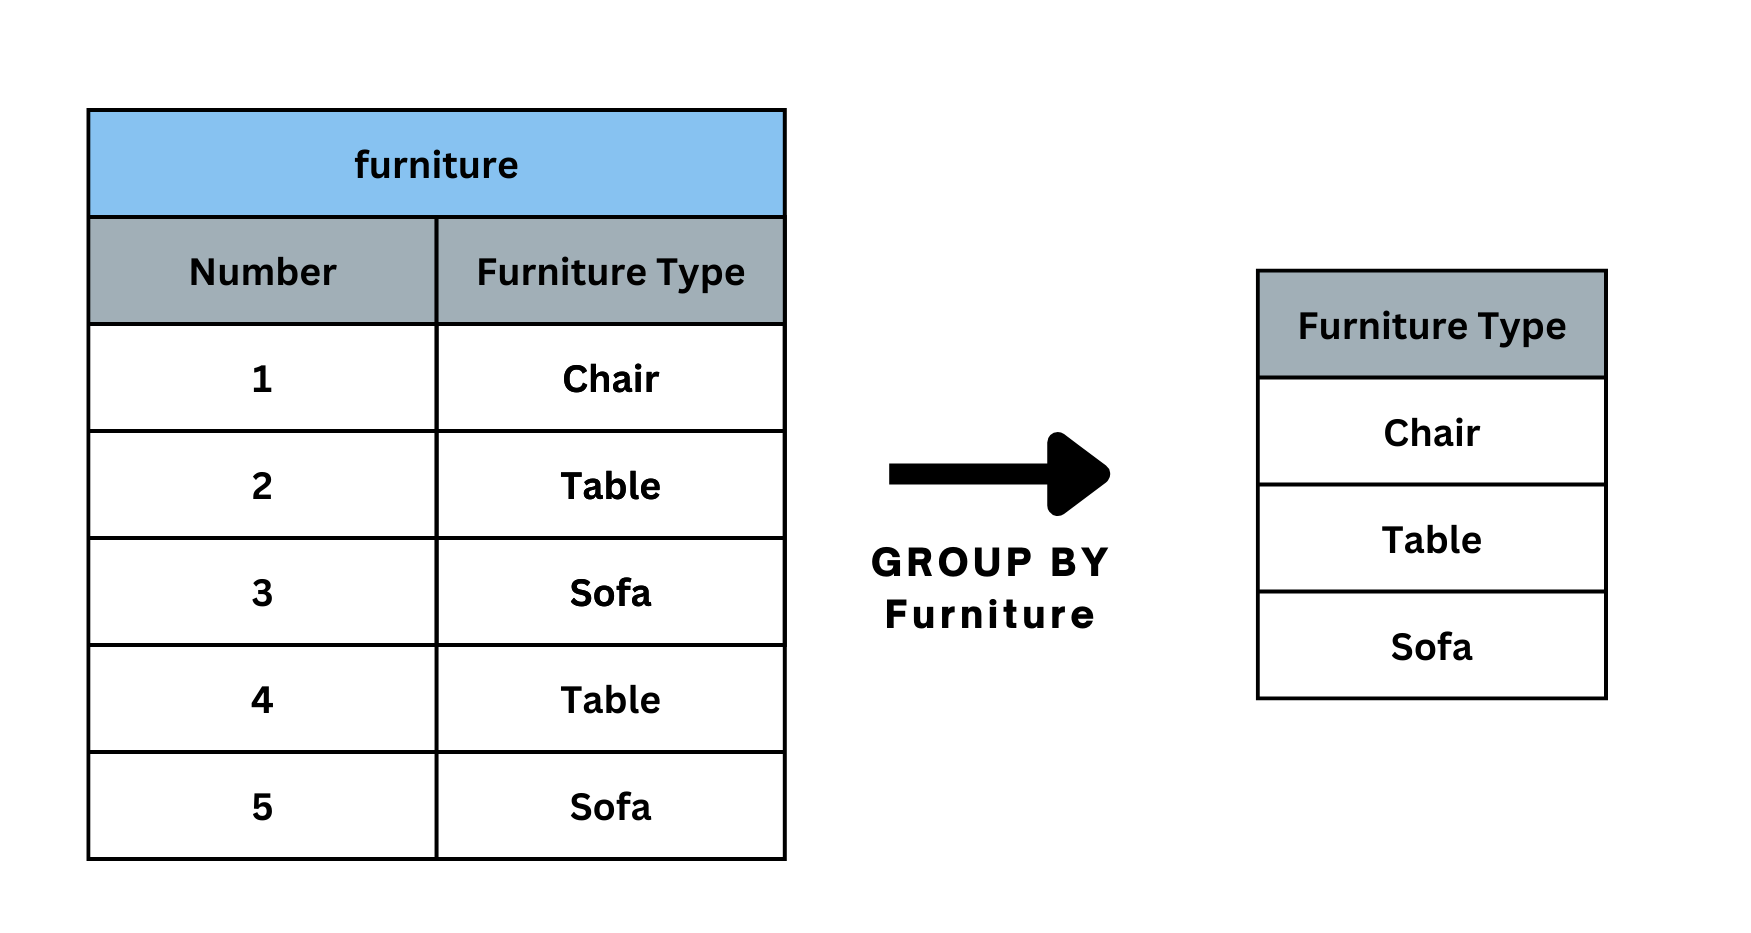
At its core, GROUP BY is used to arrange identical data into groups. Instead of looking at each individual row, it lets you summarize data across categories.
Basic Syntax:
SELECT column, AGGREGATE_FUNCTION(column)
FROM table
GROUP BY column;
This tells SQL: “Take the data in this table, group it by a certain column, and then apply an aggregation function to summarize each group.”
Why GROUP BY is Essential for Business Analysts

Business analysts are rarely asked to deliver raw data dumps. Instead, stakeholders ask questions like:
- What is the total revenue per region?
- Who are our top customers by spend?
- What is the average response time for support tickets?
Answering these requires summarization, and GROUP BY makes it possible.
In short, GROUP BY bridges the gap between raw data and meaningful KPIs.
Aggregation Functions Every Analyst Should Know
GROUP BY only works when paired with aggregation functions. These functions perform calculations on grouped data.
1. SUM()
Calculates the total of numeric values.
SELECT region, SUM(sales) AS total_sales
FROM orders
GROUP BY region;
Use case: Find the total revenue by sales region.
2. AVG()
Finds the average of numeric values.
SELECT product_id, AVG(price) AS avg_price
FROM products
GROUP BY product_id;
Use case: Discover the average price of each product.
3. COUNT()
Counts the number of rows in a group.
SELECT customer_id, COUNT(order_id) AS order_count
FROM orders
GROUP BY customer_id;
Use case: Track how many orders each customer placed.
4. MAX() and MIN()
Return the highest and lowest values.
SELECT department, MAX(salary) AS highest_salary
FROM employees
GROUP BY department;
Use case: Identify the top earners in each department.
5. DISTINCT COUNT (via COUNT + DISTINCT)
Counts unique values.
SELECT region, COUNT(DISTINCT customer_id) AS unique_customers
FROM orders
GROUP BY region;
Use case: Count how many unique customers purchased in each region.
Real-World Examples for Business Analysts
Example 1: Sales by Region
A company wants to see how its sales vary across regions.
SELECT region, SUM(sales) AS total_sales
FROM orders
GROUP BY region;
This reveals which regions are high-performing and which may need more attention.
Example 2: Customer Retention Insights
How many repeat purchases do customers make?
SELECT customer_id, COUNT(order_id) AS total_orders
FROM orders
GROUP BY customer_id
HAVING COUNT(order_id) > 1;
This filters to only show customers with multiple purchases key for retention analysis.
Example 3: Employee Productivity
Measure the number of tickets resolved per support agent.
SELECT agent_id, COUNT(ticket_id) AS tickets_resolved
FROM support_tickets
GROUP BY agent_id;
This helps identify high and low performers within the team.
GROUP BY with Multiple Columns
GROUP BY isn’t limited to one column you can group by several.
Example: Find the total sales per region and product category.
SELECT region, category, SUM(sales) AS total_sales
FROM orders
GROUP BY region, category;
This enables multidimensional analysis, which is crucial in cross-category business questions.
The HAVING Clause: Filtering After Aggregation

One of the most common mistakes new analysts make is trying to use WHERE with aggregated data. However, WHERE filters rows before grouping, while HAVING filters groups after aggregation.
Example: Show regions where sales exceed $1M.
SELECT region, SUM(sales) AS total_sales
FROM orders
GROUP BY region
HAVING SUM(sales) > 1000000;
This is a powerful way to highlight only the most impactful groups.
Common Mistakes Analysts Make with GROUP BY
- Forgetting to include non-aggregated columns in GROUP BY.
SQL requires every selected column that’s not inside an aggregation function to appear in GROUP BY. - Using WHERE instead of HAVING.
Remember: use HAVING for aggregated filters, WHERE for row-level filters. - Over-grouping.
Adding too many columns to GROUP BY can fragment results, making insights less meaningful. - Not aliasing aggregated columns.
Always use AS to give clear names to results, especially for reporting.
Performance Considerations
For small datasets, GROUP BY is straightforward. But in large-scale databases, it can become computationally expensive. Here are a few tips:
- Index columns used in GROUP BY.
- Avoid grouping on unnecessary columns.
- Use filtering (WHERE) before grouping to reduce row counts.
- Test queries with smaller data samples first.
GROUP BY in Action: A Case Study
Scenario: An e-commerce company wants to understand customer spending habits.
Question 1: What’s the total revenue by customer?
SELECT customer_id, SUM(sales) AS total_spent
FROM orders
GROUP BY customer_id;
Question 2: Who are the top 5 customers?
SELECT customer_id, SUM(sales) AS total_spent
FROM orders
GROUP BY customer_id
ORDER BY total_spent DESC
LIMIT 5;
Question 3: Which regions generate the most repeat customers?
SELECT region, COUNT(DISTINCT customer_id) AS repeat_customers
FROM orders
WHERE customer_id IN (
SELECT customer_id
FROM orders
GROUP BY customer_id
HAVING COUNT(order_id) > 1
)
GROUP BY region;
By layering GROUP BY queries, the analyst reveals insights that guide marketing strategies, customer loyalty programs, and regional resource allocation.
When Not to Use GROUP BY
Although powerful, GROUP BY isn’t always the best tool. Avoid it when:
- You only need row-level data (no summaries).
- You require running totals or rankings (better handled with window functions).
- Your dataset is extremely large and the grouping doesn’t add business value.
In those cases, consider window functions or CTEs for better efficiency.
GROUP BY vs. Window Functions: A Quick Comparison

While both summarize data, their use cases differ:
- GROUP BY collapses rows into summaries.
- Window functions add calculated values alongside existing rows.
Example:
- GROUP BY → “What’s the total sales per region?”
- Window Function → “What’s each salesperson’s sales compared to their regional total?”
As an analyst, knowing when to use each tool is critical.
GROUP BY as a Superpower for Analysts
SQL GROUP BY and aggregations form the backbone of business analysis. They allow analysts to transform raw data into digestible insights, from total sales by region to customer retention patterns.
But more importantly, they help analysts answer the “why” behind business performance, not just the “what.” When used correctly, they save time, reduce errors, and unlock powerful perspectives hidden in transactional data.
For business analysts, mastering GROUP BY isn’t just about writing cleaner queries. It’s about becoming the bridge between data and strategy.
So next time you’re asked, “Which customers bring us the most value?” or “Which region needs more attention?” you’ll know the SQL magic lies in GROUP BY and aggregations.