Dashboards have become an essential part of modern business intelligence. Organizations invest significant amounts of time and money in designing dashboards, connecting data sources, building visualizations, and making performance information available to employees and decision-makers. Yet, despite these investments, one important question is often overlooked: are people actually using the dashboards?
Creating a dashboard is not the same as creating value.
A dashboard may contain accurate data, attractive visualizations, sophisticated filters, and carefully designed KPIs, but if employees rarely open it, executives ignore it, or managers continue relying on spreadsheets and manually prepared reports, the dashboard is not achieving its intended purpose.

This is why dashboard adoption matters.
Dashboard adoption refers to the extent to which intended users consistently access, interact with, trust, and incorporate a dashboard into their regular workflows and decision-making processes. Measuring adoption therefore requires much more than counting the number of times a dashboard has been opened. A dashboard can receive thousands of views and still have very little business impact.
For Business Analysts, Data Analysts, Business Intelligence professionals, and analytics leaders, understanding dashboard adoption is becoming increasingly important. Organizations are moving toward self-service analytics, real-time reporting, AI-powered Business Intelligence, and increasingly complex data environments. Consequently, businesses need to know whether their analytics investments are actually being used.
More importantly, they need to understand why users adopt certain dashboards and reject others.
A successful dashboard should not simply display information. It should become part of the way people work. When managers use it to identify performance issues, executives use it to evaluate strategic progress, and operational teams use it to respond to changing conditions, the dashboard becomes embedded within the decision-making process.
Therefore, measuring dashboard adoption is ultimately about measuring behavior, usefulness, trust, and business impact.
Why Dashboard Adoption Matters
The importance of dashboard adoption becomes clearer when we consider how organizations typically invest in Business Intelligence.
A company may spend months gathering requirements, designing a data model, integrating systems, developing dashboards, testing calculations, and training users. After launch, however, the organization may discover that adoption is lower than expected.
Employees continue downloading Excel files.
Managers ask analysts to prepare reports manually.
Executives request PowerPoint presentations containing information that is already available in the dashboard.
Teams create their own unofficial reports because they do not understand or trust the centralized solution.
At this point, the technical project may be considered complete, but the business objective has not been achieved.
This is a critical distinction.
A dashboard is not successful because it was delivered. It is successful because people use it to accomplish something valuable.
Consequently, dashboard adoption should be treated as a key performance indicator for Business Intelligence initiatives.
High adoption suggests that users find the dashboard relevant, accessible, understandable, and trustworthy. Low adoption, on the other hand, may indicate problems with the dashboard itself, the underlying data, user training, communication, organizational processes, or the relevance of the information being presented.
Therefore, when adoption is measured properly, it becomes a diagnostic tool.
It tells organizations not only whether people are using dashboards but also where improvements may be necessary.
Dashboard Adoption Is More Than Dashboard Views
One of the most common mistakes organizations make is defining dashboard adoption simply as the number of views.
At first glance, views seem like a logical metric. If 500 employees open a dashboard every month, it appears to be widely adopted.
However, this measurement lacks context.
An employee might open a dashboard once because they received a link from their manager. Another person might open it repeatedly because it is essential to their daily work. Treating both users as equally engaged would create a misleading picture.
Similarly, one person might open a dashboard 100 times but never use the information to make a decision.
Therefore, dashboard views should be treated as one signal rather than the complete definition of adoption.
True adoption requires examining how frequently users access the dashboard, whether they return to it, which features they use, whether they interact with the information, whether the dashboard has replaced manual reporting, and whether it influences decisions or actions.
This is why dashboard adoption should be viewed as a behavioral measurement problem.
The central question is not simply, “Did someone open the dashboard?”
The better question is, “Has the dashboard become useful enough to change how the user works?”
That shift in perspective makes dashboard adoption much easier to measure meaningfully.
Start by Defining What Adoption Means
Before measuring dashboard adoption, organizations must define what successful adoption looks like.
This sounds straightforward, but different dashboards can have completely different adoption expectations.
An executive dashboard might be reviewed once a week or once a month because executives are interested in strategic trends rather than daily operational activity.
An operations dashboard, however, might need to be accessed several times a day because users are monitoring orders, inventory, service levels, or production performance.
Therefore, there is no universal number of dashboard views that represents success.
The appropriate adoption benchmark depends on the dashboard’s purpose, target audience, workflow, and decision cycle.
For example, if a dashboard was designed to support daily inventory decisions, consistent daily usage would probably be a strong indicator of adoption. If a dashboard was designed for monthly financial performance reviews, expecting users to open it every day would be unnecessary.
Consequently, the first step is to connect dashboard adoption to the business process it supports.
The organization needs to understand who the intended users are, what decisions they are expected to make, how frequently those decisions occur, and where the dashboard fits into the workflow.
Once those factors are understood, meaningful adoption metrics can be established.
Measure the Right Users, Not Just Total Users
Another important consideration is the difference between total users and intended users.
Suppose a dashboard was designed for 50 regional managers. During the first month, 200 employees access it.
At first, that sounds impressive.
However, if only 20 of the 50 regional managers are regularly using it, the dashboard may actually have an adoption problem among its primary audience.
This is why adoption analysis should focus on the target user population.
Business Intelligence teams should understand which users were expected to use the dashboard and compare actual usage against that population.
This approach provides a much more meaningful adoption rate.
For example, if 80 percent of intended users access the dashboard regularly, that suggests stronger adoption than simply reporting that 1,000 people viewed the dashboard.
Furthermore, user segmentation can reveal important differences between departments, roles, locations, seniority levels, or business units.
Perhaps finance has high adoption while sales has very low adoption.
Perhaps senior managers use the dashboard regularly while frontline employees rarely access it.
These differences can provide valuable clues about the reasons behind adoption patterns.
Measure Active Users Over Time
One of the most useful dashboard adoption metrics is the number of active users over a defined period.
Depending on the dashboard’s purpose, organizations may examine daily active users, weekly active users, or monthly active users.
However, the number itself is not enough.
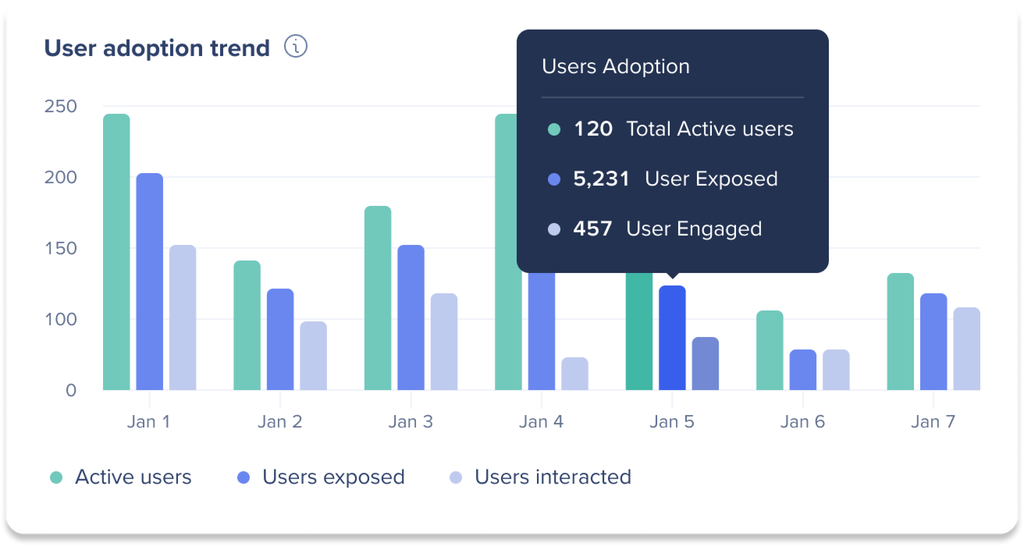
The trend matters.
Suppose a new dashboard launches with 300 active users during the first month. By the third month, active users have fallen to 100.
The initial launch appears successful, but the declining trend suggests that users are not developing a lasting habit.
Perhaps the dashboard was exciting when it launched but failed to provide ongoing value. Perhaps the underlying data is not updated frequently enough. Perhaps users encountered usability problems. Perhaps managers were not reinforcing its use.
Conversely, a dashboard that starts with relatively low usage but gradually increases may indicate healthy adoption.
Therefore, adoption should be measured longitudinally rather than as a single snapshot.
The goal is to determine whether usage is becoming habitual.
Measure Frequency of Use
Frequency provides another important dimension of adoption.
A user who opens a dashboard once every six months is technically a user, but that does not necessarily indicate meaningful adoption.
Frequency helps organizations distinguish occasional users from habitual users.
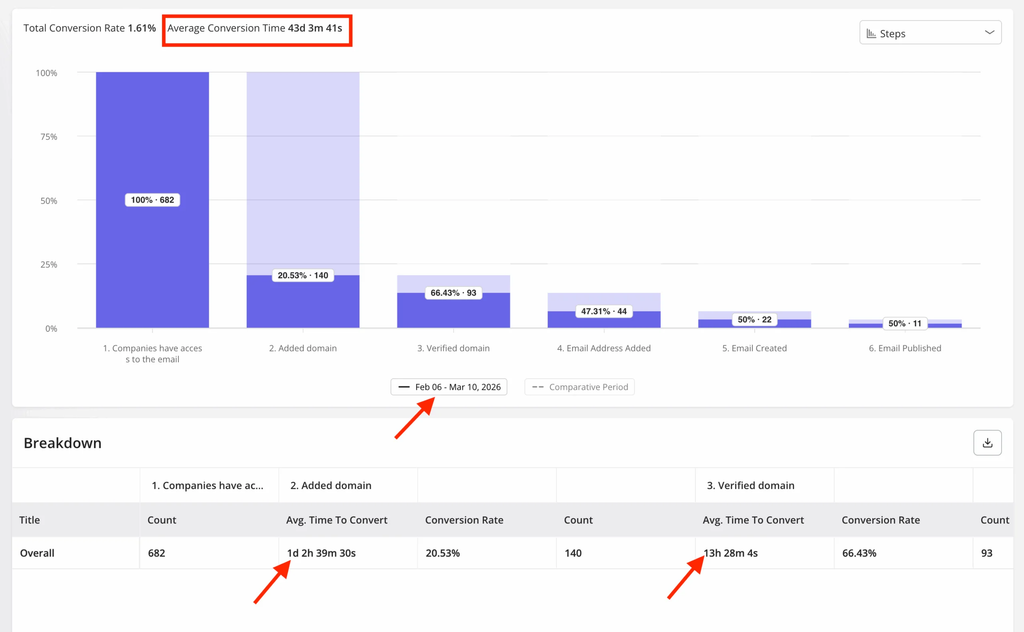
However, frequency should again be interpreted within context.
A weekly strategy dashboard may be considered highly adopted if most executives review it once a week. A real-time operations dashboard may require much more frequent interaction.
Therefore, analysts should establish expected usage patterns based on the dashboard’s business purpose.
Once that benchmark exists, actual behavior can be compared with expected behavior.
This comparison is particularly useful because it identifies gaps between intended and actual usage.
If a dashboard is designed for weekly management meetings but most managers only access it once a month, the organization has evidence that adoption is weaker than intended.
The next question then becomes why.
Measure User Retention
Another powerful way to understand adoption is to examine whether users continue returning after their initial interaction.
This is particularly important after a dashboard launch.
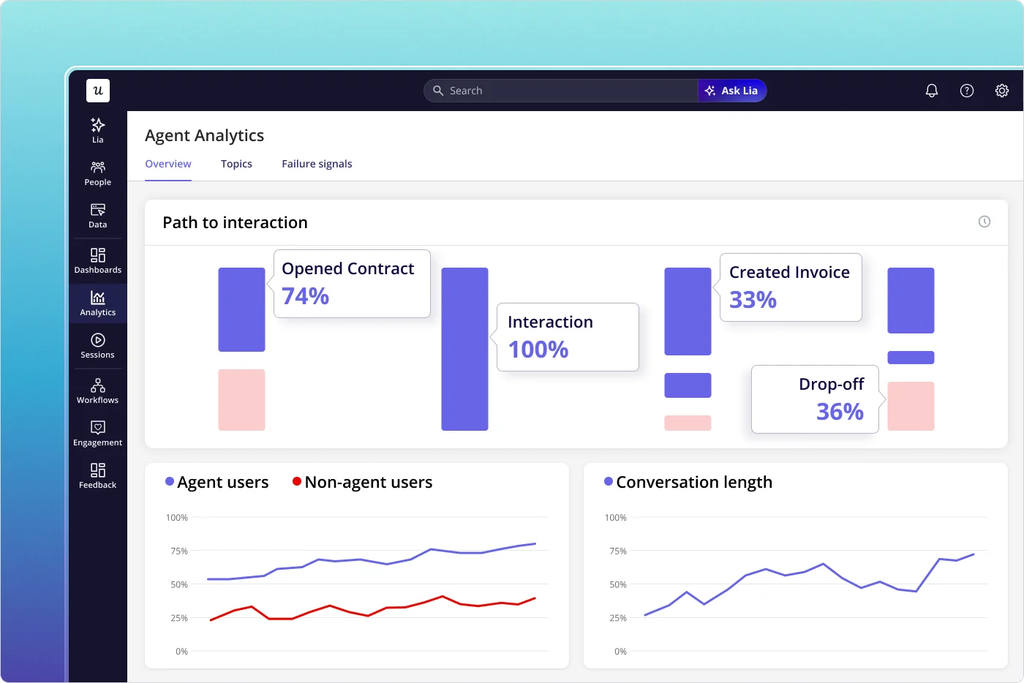
A high number of first-time users may indicate strong awareness or successful communication. However, if those users never return, the dashboard may not be providing enough value.
User retention therefore helps answer a deeper question: does the dashboard become part of the user’s routine?
For example, an organization might discover that 70 percent of invited users accessed a dashboard during its first month, but only 30 percent remained active during the following quarter.
That pattern suggests a potential adoption problem.
Perhaps users were initially curious but did not find the dashboard useful.
Perhaps training was insufficient.
Perhaps the information was redundant with existing reports.
Perhaps the dashboard did not align with users’ daily responsibilities.
Retention analysis provides the evidence needed to investigate these possibilities.
Measure Engagement With Dashboard Features
Dashboard adoption should also consider how users interact with the dashboard.
Modern Business Intelligence platforms often provide information about filters, drill-downs, page navigation, exports, bookmarks, and other interactions.
These behaviors can provide useful insight.
For instance, if users consistently filter by region and product category, that may indicate that these dimensions are important to their decisions.
If users never interact with certain pages, those pages may be unnecessary or poorly designed.
If users frequently export data to Excel, that behavior may indicate that the dashboard does not fully support their workflow.
The last example is especially important.
Exporting data is not automatically a negative behavior. Sometimes users legitimately need to perform additional analysis.
However, consistently exporting large amounts of data may suggest that users do not consider the dashboard itself sufficient.
Therefore, feature usage should be interpreted rather than judged.
The goal is to understand how the dashboard fits into the user’s work.
Measure Search and Navigation Behavior
In some Business Intelligence environments, users can access dashboards through portals or analytics platforms containing many reports.
In such environments, search and navigation behavior can reveal another layer of adoption.
If users repeatedly search for a particular dashboard, that may indicate that the dashboard is valuable but difficult to discover.
If users consistently access it through bookmarks or direct links, that may suggest it has become part of their routine.
If users rarely find it through the organization’s BI platform, the issue may be discoverability rather than usefulness.
This distinction matters because organizations sometimes interpret low usage as a content problem when the actual problem is accessibility.
A valuable dashboard that users cannot easily locate will struggle to achieve adoption.
Therefore, dashboard adoption should consider the entire user journey, from discovery to interaction to decision-making.
Measure Adoption Against Business Processes
One of the strongest ways to measure dashboard adoption is to connect usage data with business processes.
For example, if a dashboard was created to support weekly sales meetings, analysts can examine whether sales managers access the dashboard before those meetings.
If an operations dashboard was designed to monitor service-level performance, analysts can examine whether teams consult it before operational interventions.
This creates a stronger connection between dashboard activity and business behavior.
Instead of simply measuring whether someone opened the dashboard, the organization can evaluate whether the dashboard is being used at the moment it is supposed to influence a decision.
This is a much more meaningful definition of adoption.
A dashboard becomes valuable when it enters the workflow.
If users open it regularly but continue making decisions using separate spreadsheets, adoption may still be incomplete.
Therefore, measuring dashboard adoption requires understanding not just digital activity but business activity.
Measure the Replacement of Manual Reporting
One of the clearest indicators of dashboard success is the reduction of manual reporting.
Many organizations create dashboards specifically to eliminate repetitive reporting processes.
Before the dashboard, an analyst might spend several hours every Monday extracting data, cleaning spreadsheets, updating formulas, creating charts, and distributing reports.
After implementation, users should ideally access the dashboard directly.
If analysts continue producing the same manual reports months after the dashboard launch, something may be wrong.
Perhaps users do not trust the dashboard.
Perhaps the dashboard does not contain the information they need.
Perhaps stakeholders are unaware that the dashboard exists.
Perhaps organizational habits have not changed.
Therefore, tracking the volume and frequency of manual reports can provide an important adoption signal.
A successful dashboard should ideally reduce unnecessary reporting duplication.
This does not mean that every manual report should disappear. Some reports have legitimate purposes. Nevertheless, when a dashboard is specifically intended to replace a manual reporting process, the reduction of that process should be measured.
Measure User Feedback and Satisfaction
Usage data tells you what people do.
It does not always tell you why they do it.
Therefore, qualitative feedback should complement quantitative adoption metrics.
Users can provide valuable insights into dashboard usefulness, clarity, trust, performance, accessibility, and relevance.
A dashboard might have low adoption because the data is difficult to understand.
Another might have low adoption because it loads too slowly.
A third might be ignored because the KPIs do not match the metrics managers are evaluated against.
These problems may not be obvious from usage logs alone.
Short user surveys, interviews, feedback sessions, and stakeholder discussions can therefore provide essential context.
The most useful feedback questions focus on whether the dashboard helps users perform their responsibilities more effectively.
The goal is not simply to ask whether users “like” the dashboard.
A visually attractive dashboard can still be strategically useless.
Instead, organizations should focus on whether the dashboard helps users find information, identify problems, monitor performance, and make decisions.
Measure Trust in the Dashboard
Trust is one of the strongest predictors of dashboard adoption.
Users will not consistently rely on information they believe is inaccurate.
This is why data quality and dashboard adoption are closely connected.
Suppose managers notice that a dashboard’s revenue figure does not match the finance report. Even if the difference has a legitimate explanation, the inconsistency can damage confidence.
Once users begin questioning the numbers, they may return to spreadsheets or ask analysts to manually verify information.
Over time, dashboard usage declines.
Therefore, organizations should measure whether users trust the data.
This can be explored through surveys, interviews, support requests, reconciliation issues, and usage behavior.
Frequent questions such as “Why is this number different from the finance report?” can be treated as signals of a trust problem.
Similarly, repeated requests for manually verified figures may indicate that users are not comfortable relying on the dashboard independently.
Trust should therefore be treated as an adoption metric, not merely a data governance concern.
Measure Dashboard Performance
Technical performance also affects adoption.
A dashboard that takes several minutes to load creates friction.
A report that frequently fails creates frustration.
A visualization that becomes unresponsive when filters are applied discourages exploration.
Consequently, organizations should examine technical performance alongside usage behavior.
Slow dashboards may experience declining adoption even when their underlying content is valuable.
This is particularly important for dashboards connected to large datasets, complex calculations, or multiple data sources.
Users have limited patience.
If an alternative method provides the required information faster, they will often use it.
Therefore, improving technical performance can directly improve adoption.
Measure Adoption by Department and Role
Overall adoption rates can hide important patterns.
For this reason, organizations should examine adoption across different user groups.
A dashboard may be highly successful within finance but poorly adopted by marketing.
Alternatively, senior executives may use it frequently while operational staff rarely access it.
These differences can reveal whether the dashboard is aligned with the needs of specific audiences.
For example, low adoption among executives might indicate that the dashboard contains too much operational detail.
Low adoption among analysts might indicate insufficient data access or flexibility.
Low adoption among frontline employees might indicate that the dashboard is not connected to their daily responsibilities.
Therefore, segmentation is essential.
The question is not simply whether the dashboard is adopted.
It is adopted by whom?
And for what purpose?
Measure Adoption Across the Dashboard Lifecycle
Dashboard adoption should not be treated as something that is measured only after launch.
It should be monitored throughout the dashboard lifecycle.
During development, analysts should establish intended users, business objectives, expected usage patterns, and success criteria.
During launch, the organization can measure awareness, initial access, and early engagement.
After launch, it can measure retention, frequency, feature usage, and integration into workflows.
Later, the organization can evaluate whether the dashboard continues to provide value.
This lifecycle perspective is important because dashboards can become less relevant over time.
Business strategies change.
KPIs change.
Organizational structures change.
Data sources change.
User expectations change.
A dashboard that was highly valuable two years ago may no longer support today’s decisions.
Consequently, declining adoption is not always a user problem.
Sometimes it is a signal that the dashboard itself needs to evolve.
Why Low Adoption Should Not Automatically Be Blamed on Users
When dashboard adoption is low, organizations sometimes assume that users are resistant to change.
That explanation may occasionally be correct, but it should not be the first assumption.
Low adoption can result from many factors.
The dashboard may not answer important business questions.
The data may not be trusted.
The interface may be difficult to navigate.
Users may not know that the dashboard exists.
Training may have been inadequate.
The dashboard may be too slow.
The information may be available through a more convenient tool.
The dashboard may not align with existing workflows.
Consequently, organizations should investigate before assigning blame.
This is where Business Analysts can play an important role.
Rather than simply reporting low usage, analysts can investigate the reasons behind it.
They can combine usage analytics, user feedback, technical performance data, and business process information to identify the real barriers.
That turns adoption measurement into an improvement process.
Turning Adoption Data Into Action
Measuring dashboard adoption is useful only when the results lead to action.
Suppose an organization discovers that dashboard adoption among regional managers is only 35 percent.
That number alone does not explain what should happen next.
The organization needs to investigate the underlying causes.
If managers say they cannot find the information they need, the dashboard may need redesigning.
If they do not trust the numbers, data quality and reconciliation issues should be addressed.
If they do not know how to use the dashboard, training may be appropriate.
If they prefer another reporting process, the organization should understand why.
If the dashboard is too slow, technical optimization may be required.
This illustrates an important principle.
Adoption metrics are diagnostic indicators.
They identify where attention is needed, but they do not automatically provide the solution.
Therefore, Business Intelligence teams should treat adoption measurement as part of a continuous improvement cycle.
Measure.
Investigate.
Improve.
Measure again.
Over time, this creates dashboards that are increasingly aligned with real business needs.
The Role of Business Analysts in Dashboard Adoption
Business Analysts are particularly well positioned to improve dashboard adoption because they operate at the intersection of business requirements, user needs, processes, and data.
They can help define what the dashboard should accomplish before development begins.
They can identify the decisions the dashboard needs to support.
They can determine who the intended users are.
They can document the KPIs and business definitions.
They can gather user feedback after launch.
They can analyze adoption patterns.
Most importantly, they can translate adoption problems into business requirements for improvement.
For example, if users frequently export data to Excel because they need to compare performance across custom periods, the Business Analyst can investigate whether the dashboard should include more flexible filtering.
If executives ignore the dashboard because it contains too much detail, the analyst can recommend a more focused executive view.
If users distrust the information because metrics conflict with existing reports, the analyst can coordinate with data owners to establish consistent definitions.
In this way, dashboard adoption becomes part of the broader Business Analysis discipline.
Dashboard Adoption in the Age of AI
Artificial intelligence is changing Business Intelligence rapidly.
Natural language interfaces allow users to ask questions about data without navigating complex dashboards. AI-generated summaries can explain trends. Automated insights can identify anomalies. Predictive analytics can highlight potential future outcomes.
These developments could reduce traditional dashboard usage in some situations.
However, they do not eliminate the need to measure adoption.
Instead, the definition of adoption may evolve.
Users may interact with analytics through conversational interfaces rather than traditional visual dashboards.
They may consume automated insights instead of manually exploring charts.
They may receive alerts rather than opening reports.
Consequently, organizations should focus increasingly on analytical engagement rather than dashboard views alone.
The fundamental question remains the same.
Is the organization’s analytics capability helping people make better decisions?
Whether that capability is delivered through a dashboard, an AI assistant, an alert, or a natural language interface is secondary.
This represents an important shift in the future of Business Intelligence.
The goal is not to maximize dashboard usage.
The goal is to maximize the value created from data.
From Dashboard Adoption to Decision Adoption
Ultimately, the most advanced organizations will move beyond measuring dashboard adoption altogether.
They will measure decision adoption.
This means examining whether analytical information is actually influencing business behavior.
Suppose a sales dashboard identifies declining performance in a particular region.
The dashboard is valuable if the sales team recognizes the problem, investigates the cause, changes its strategy, and subsequently improves performance.
The dashboard itself did not create the result.
The decision supported by the dashboard did.
Therefore, the strongest measure of analytics success is not necessarily how many times a dashboard was viewed.
It is whether the information helped the organization act more intelligently.
This is the difference between analytics consumption and analytics impact.
A dashboard can have millions of views without influencing a single meaningful decision.
Another dashboard may have only a few dozen users but directly support millions of dollars in strategic decisions.
Consequently, organizations should avoid measuring dashboards purely through vanity metrics.
The value of analytics is ultimately determined by the quality of decisions it enables.
Measure Adoption to Create Better Analytics
Dashboard adoption is one of the most important but frequently overlooked aspects of Business Intelligence.
Organizations often focus heavily on building dashboards while paying insufficient attention to what happens after those dashboards are launched.
However, the real measure of success begins after implementation.
Are intended users accessing the dashboard?
Are they returning consistently?
Are they interacting with the information?
Do they trust the numbers?
Has the dashboard become part of their workflow?
Has it reduced manual reporting?
Does it support important decisions?
These questions provide a much more complete understanding of adoption.
At the same time, organizations should remember that dashboard adoption is not simply a technology metric. It is a combination of user behavior, business relevance, data quality, usability, trust, technical performance, and organizational culture.
Therefore, low adoption should not automatically be interpreted as user resistance.
It may indicate that the dashboard does not solve the right problem.
It may reveal a data quality issue.
It may expose weak communication or training.
It may indicate that the dashboard is difficult to use.
Or it may simply mean that the business has changed while the dashboard has not.
The most effective organizations continuously monitor these signals and use them to improve their analytics environment.
Ultimately, the goal should not be to build dashboards that people are forced to use.
The goal is to build dashboards that people choose to use because they provide information that is relevant, trustworthy, accessible, and valuable.
That is the difference between deploying a dashboard and achieving dashboard adoption.
And in a mature data-driven organization, the final objective goes even further.
The dashboard should not simply be opened.
It should help someone understand what is happening, determine what matters, decide what to do next, and take action with greater confidence.
That is when a dashboard stops being another reporting tool and becomes a genuine decision-making asset.
A dashboard isn’t successful because people can access it.
It’s successful when they use it to make decisions.
Measuring dashboard adoption goes beyond counting views.
You need to understand whether users return regularly, trust the data, interact with the insights, and actually use the information in their daily workflows.
Low adoption isn’t always a user problem. Sometimes the dashboard is too slow, too complex, irrelevant, or simply doesn’t answer the questions users need.
The real goal isn’t more dashboard views.
It’s better decisions powered by data.
#BusinessAnalysis #DataAnalytics #BusinessIntelligence #Dashboard #DataDrivenDecisionMaking #Analytics